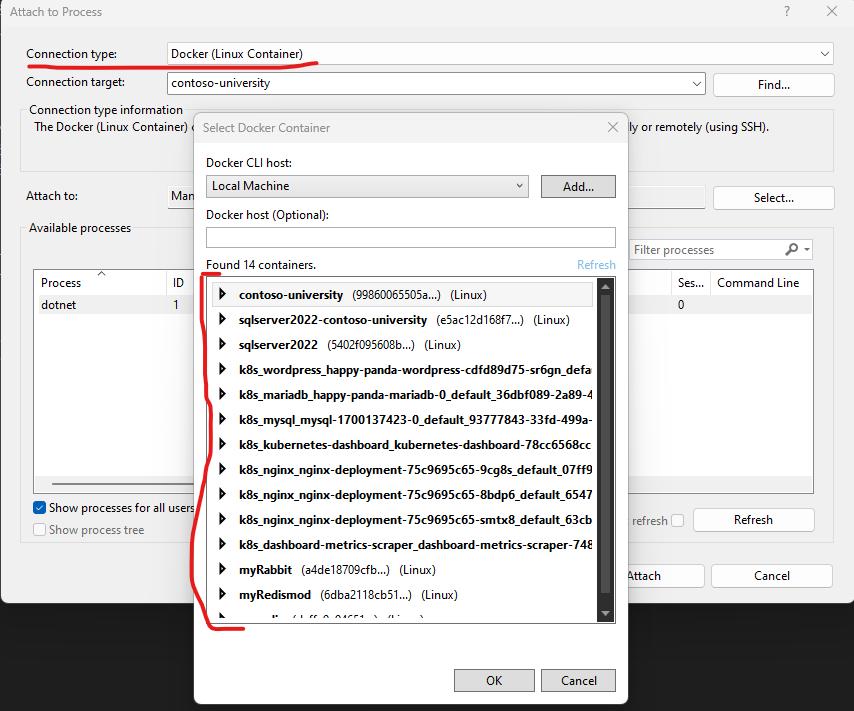
Attaching to remote docker container
导读:Attaching to a docker container is quite similar to attaching to a process,.the different part is that you need to select the corresponding
Attaching to a docker container is quite similar to attaching to a process, the different part is that you need to select the corresponding connection type and connection target.

You may encounter the following issues when debugging with the attached docker container.
1. Unable to find debugger script at ‘/root/.vs-debugger’
This is usually because the vs-debugger is not installed, and can be resolved with the following commands.
docker exec -u root <container-name> sh -c "apt-get update && apt-get install wget -y"
docker exec <container-name> sh -c "mkdir -p ~/.vs-debugger; wget https://aka.ms/getvsdbgsh -O ~/.vs-debugger/GetVsDbg.sh; chmod a+x ~/.vs-debugger/GetVsDbg.sh"
2. ‘The breakpoint will not currently be hit’ warning
Check the docker file, the image is built and published to ‘Release’ by default, it needs to be ‘Debug’ for debugging purposes, which is the most common mistake. You could also introduce a build/publish mode ARG, and make it configurable, for example
In the docker file define ARG ‘Mode’
.......

ARG Mode=Debug
RUN echo "$Mode"

COPY ["xxx.csproj", "xxx/"]
RUN dotnet restore "xxx.csproj"
COPY . .
WORKDIR "/src/xxx"
RUN dotnet build "xxx.csproj" -c $Mode -o /app/build

FROM build AS publish
RUN dotnet publish "xxx.csproj" -c $Mode -o /app/publish /p:UseAppHost=false

.........
Then in the docker-compose file, assign the Mode with Debug or Release.
services:
  app:
    image: xxx:latest
    build:
      context: .
      dockerfile: Dockerfile
      args:
        - Mode=Debug
3. Breakpoints look all right but can be hit anyway.
This is usually more complicated, but there are a few checkpoints you could start with.
a. Check the Debug->Windows->Mudules, and make sure the required symbols are loaded. Sometimes the list is empty, no worry, it’s loading, and the breakpoint will work when it’s all loaded.

b. Set
上一篇:三维模型轻量化在移动应用场景的如
下一篇:IAM系统的权限管理体系介绍


